
Counting every learner: How Uganda made disability data work for inclusive education
Education officials in Mayuge District, Uganda, used DHIS2 to classify 1,746 learners by type and level of disability, then used that evidence to open a special needs education unit at Ikulwe Primary School and secure trained teachers, ramps and braille machines.
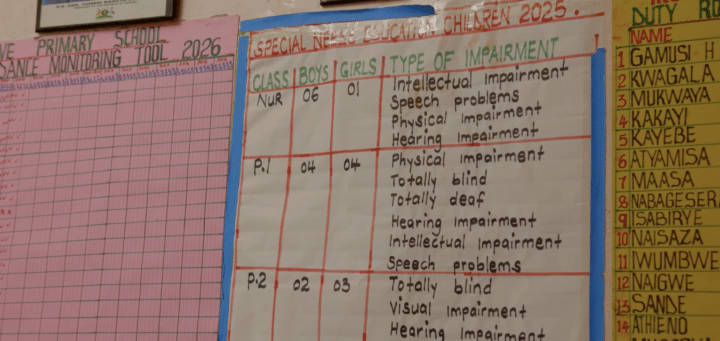
For years, Ugandan schools reported learners with disabilities as a single number. A learner who was blind and a learner who could not read the blackboard appeared in the same column. A district officer reading the statistical form could tell that a school enrolled learners with disabilities, but not what those learners needed.
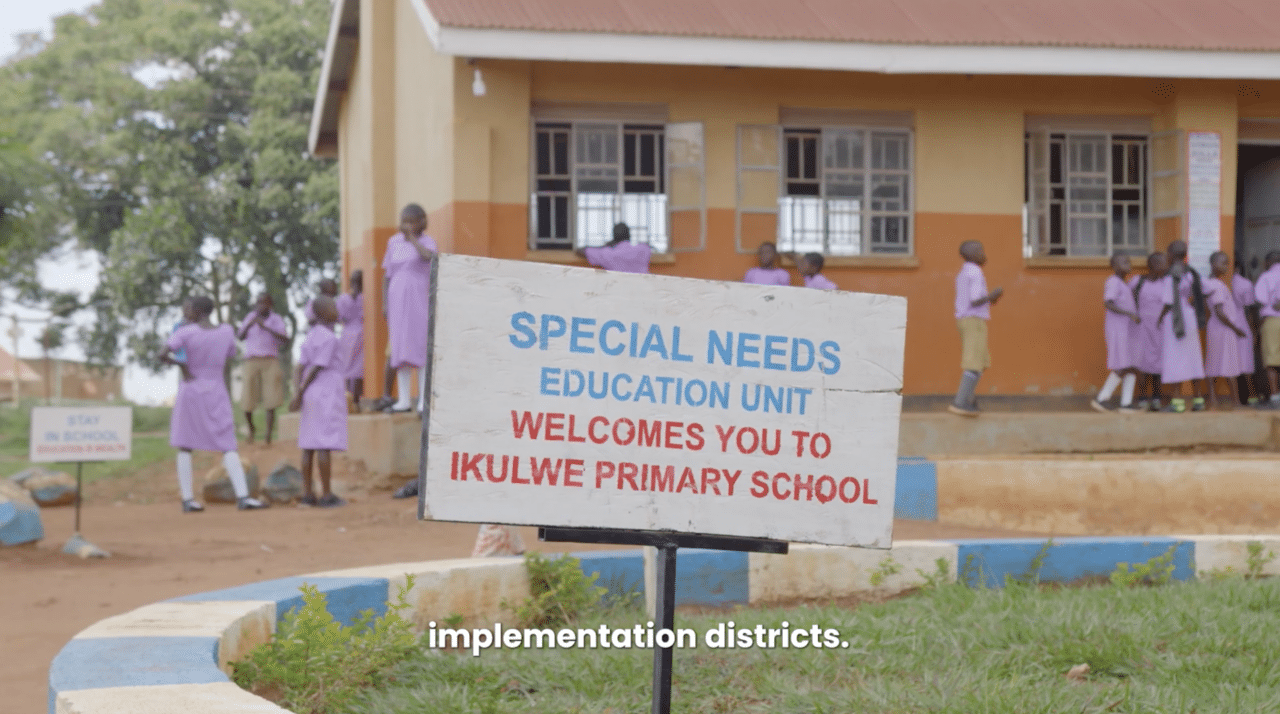
That has changed in Mayuge District. Using DHIS2, district education officials can now classify all 1,746 learners with disabilities in the district by type and level of disability and identify the schools they attend. They have used that evidence to advocate successfully for a special needs education unit at Ikulwe Primary School, which opened in October 2025, along with trained teachers, accessible infrastructure and assistive learning materials.
Reporting learners with disabilities as a single undifferentiated total
Uganda’s education sector has committed to Sustainable Development Goal 4 and to an education system that reaches every learner. But planning for inclusion depends on being able to see who is being excluded, and the routine data could not show this.
The consequences were practical. A district cannot request a braille machine, a ramp or a trained special needs teacher on the strength of an undifferentiated total. It cannot argue for a budget line it cannot describe.
Differentiated counts point to different responses. A count of learners with visual impairments supports the case for a teacher trained to work with them. A count of learners who need mobility support informs where ramps are built. A count of where those learners are concentrated shows which schools should come first.
Redesigning the collection tools to capture disability by category and level
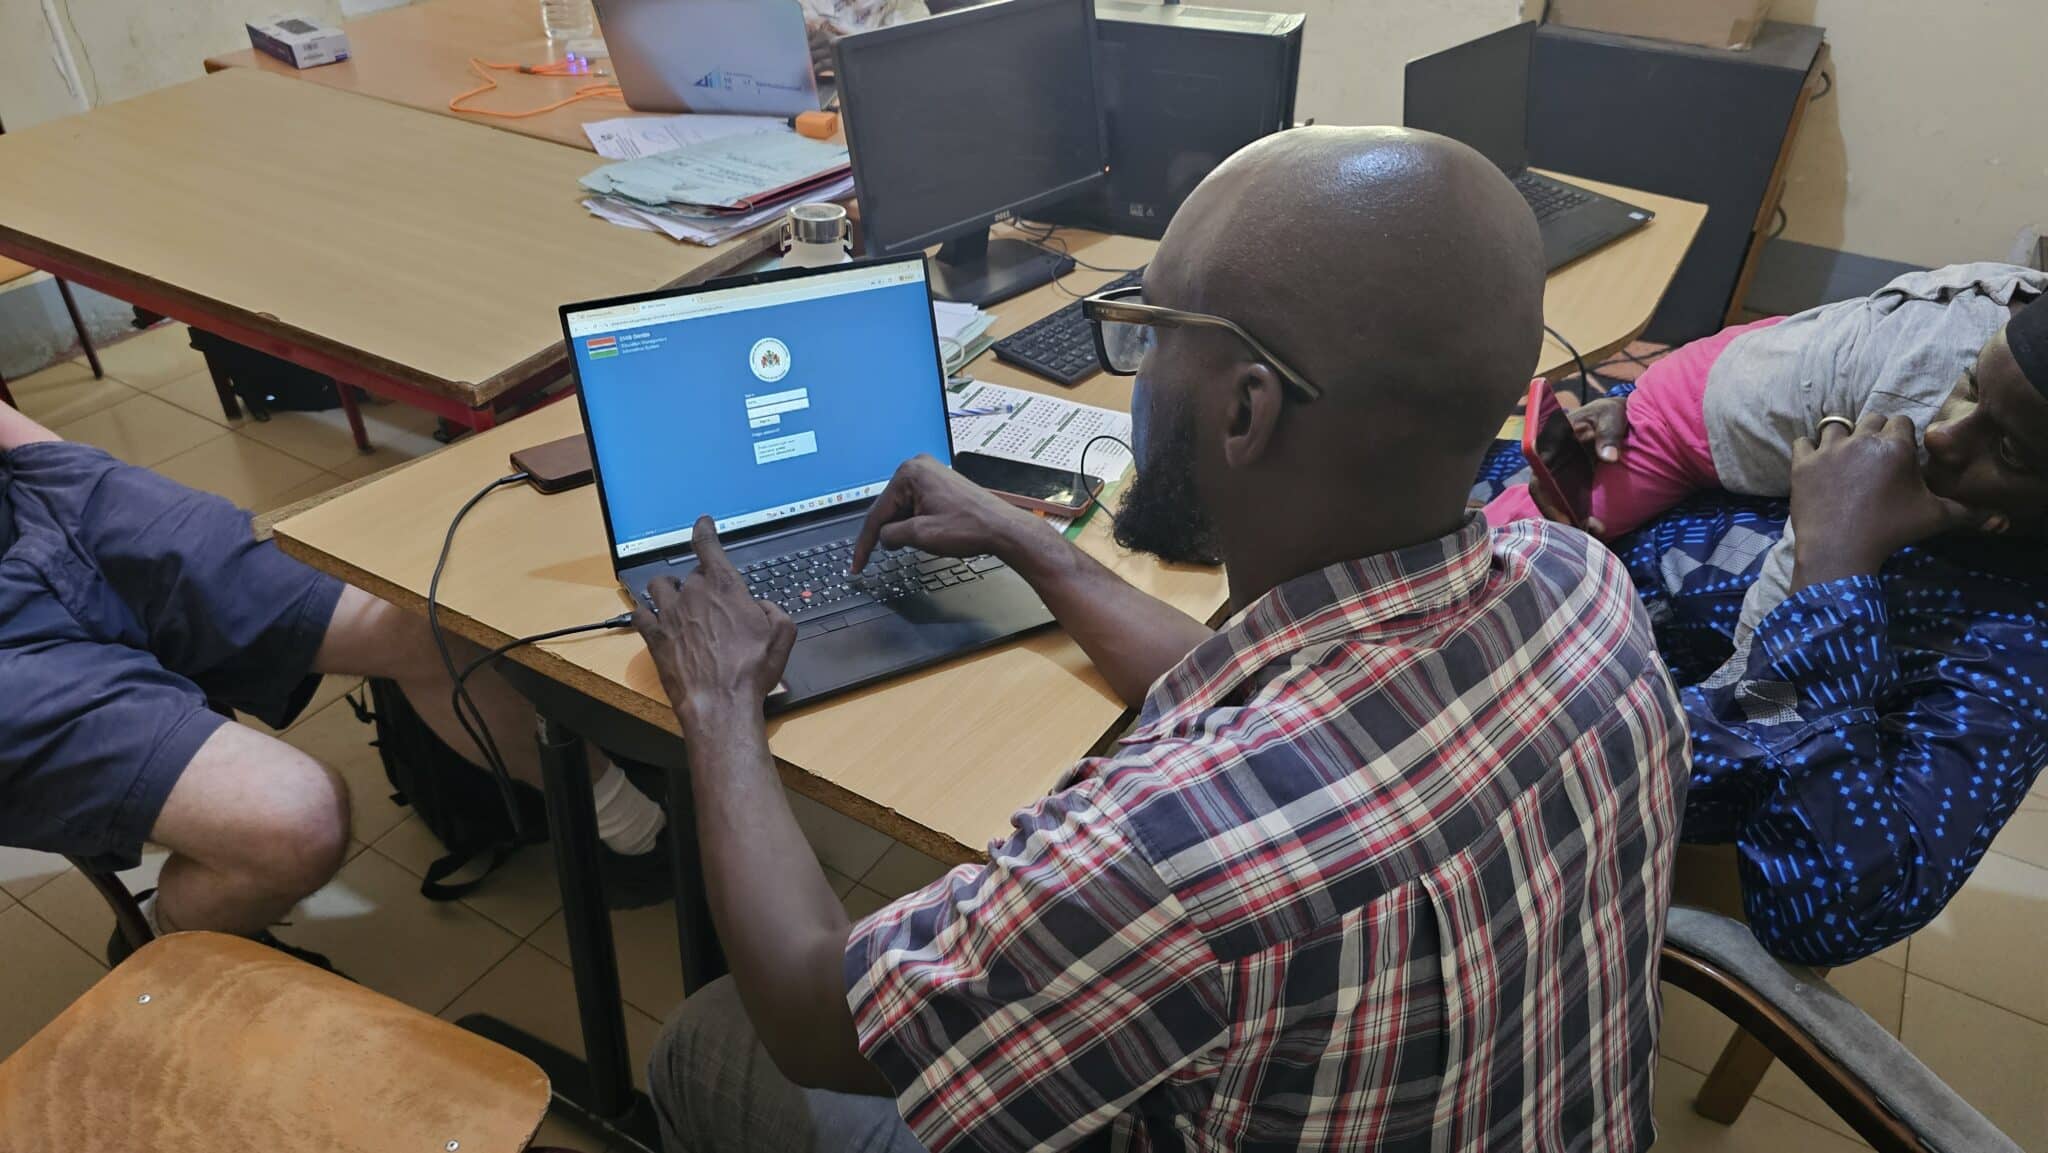
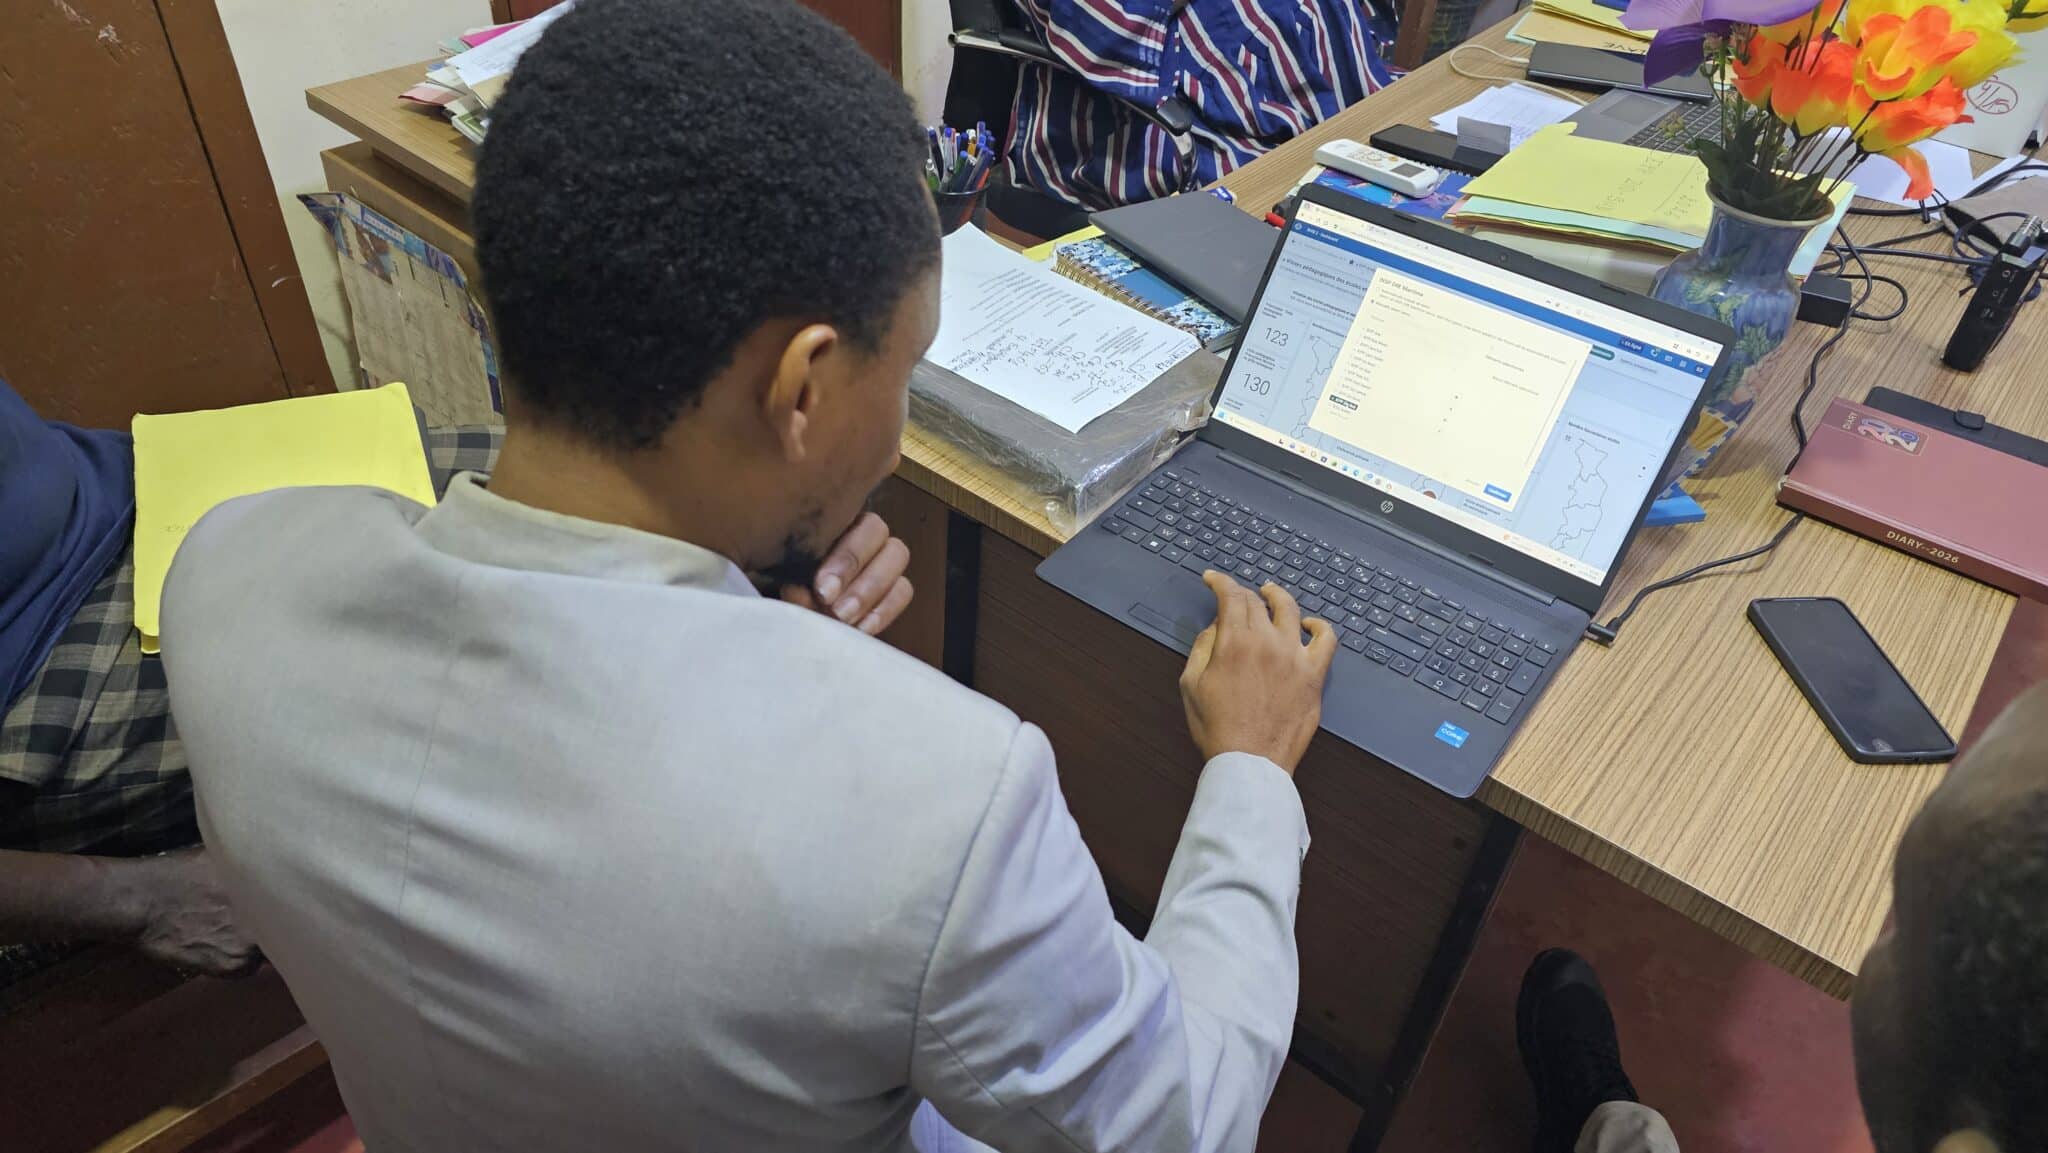
Under the GPE KIX-funded DHIS2 for Education project, HISP Uganda worked with the Ministry of Education and Sports and the district and local governments to redesign the routine data collection tools so that disability data were captured by category and level of disability. The project combined three things that had to move together: customization of the DHIS2 instance, training for district education staff and head teachers on collecting and analyzing the new data, and support to district leadership on using what the data showed.
The result was that Mayuge District could, for the first time, classify its 1,746 learners, disaggregated by type and level of disability, and locate which schools they attended.
Disaggregated data supported the case for a special needs education unit at Ikulwe Primary School
Evidence does not act on its own. What made the difference in Mayuge was that district education officials took the disaggregated data and used it to make a case.
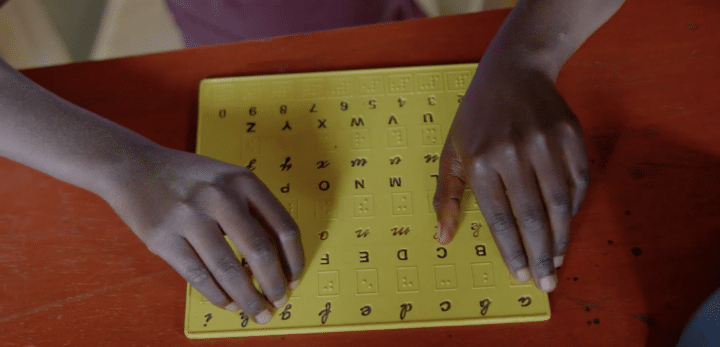
They used it to advocate for the establishment of a Special Needs Education unit at Ikulwe Primary School, which opened in October 2025. They used it to press for the recruitment and deployment of trained special needs teachers. And they used it to justify investment in accessible infrastructure like ramps at the school, and in assistive learning materials like Braille machines.
As the school became better equipped to identify and support learners with disabilities, enrollment of those learners increased. Parents responded to a system that could now see their children. One parent, whose child transferred to the school after the unit opened, described improvements in the child’s handwriting and academic performance—and, as importantly, in the child’s confidence and happiness.
Monitoring by sex and disability category reveals disparities a single total conceals
Making disability visible in routine data has effects beyond any single school. Learners with disabilities are among the most marginalized in the education system, and learners who are not counted are difficult to plan for. Disaggregated data allow a district to allocate resources according to need rather than assumption.
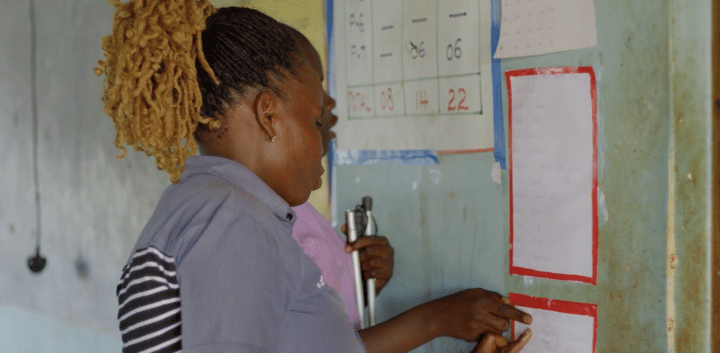
It also makes intersecting disadvantages visible. Girls with disabilities face compounding barriers to education, and monitoring participation by both sex and disability category lets district leaders see disparities that a single disability total would conceal. Mayuge now has the data to ask that question. Answering it is the next stage of the work.
Looking forward: Local leadership, technical capacity and a budget to respond
The Mayuge experience challenges a common assumption about education data systems: that the goal is better data quality. Better data quality was necessary here, but it was not sufficient, and it was not the point. The point was that the data became detailed enough, available enough and trusted enough that district and school leaders could act on it—and that those leaders chose to.
That combination is what makes the change durable: high-quality disaggregated data, local leadership willing to use it, technical capacity to sustain the system, and decision-makers with the mandate and the budget to respond. Changing any one of these could mean a different outcome in Mayuge.
The DHIS2 for Education project is documenting experiences like Mayuge’s as part of the final learning phase of the GPE KIX action-research program. The intent of this documentation is to share the factors that determined whether disaggregated disability data changed what a district did.
—
The DHIS2 for Education work in Uganda is implemented by HISP Uganda in collaboration with the Ministry of Education and Sports and district local governments, with funding from the Global Partnership for Education Knowledge and Innovation Exchange (GPE KIX). DHIS2 is a global collaboration led by HISP UiO at the University of Oslo.