
Using DHIS2 to Plan Teacher Deployment and School Construction in Togo
Regional education offices in Togo now analyze school census data directly in DHIS2 to deploy teachers, prioritize school construction and target classroom furniture shortages—work that once depended on centrally produced reports, and that has left planners asking for data more current than the annual census cycle provides.
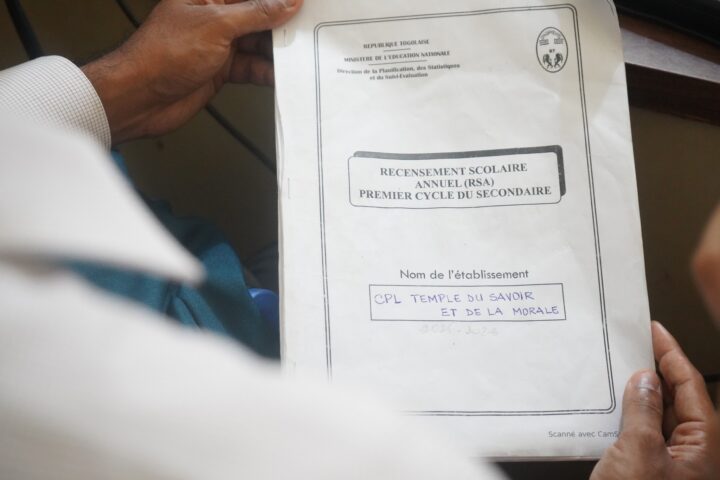
For education officials in Togo’s regional directorates, deciding where to post a teacher, which school to repair first or where classrooms needed furniture meant working from annual reports produced at the center. Schools recorded their data on paper forms, which were forwarded to inspectorates for entry into StatEduc, the statistical application behind the annual census. The results surfaced months later in a national sector review that few of the people who had generated the data ever read.
The delay was a consequence of the way Togo’s education management information system (EMIS) was built. The system was centered on the annual school census and was designed to produce only an annual statistical report, which it did. But regional and inspection-level staff make decisions during the school year, and they were largely outside of that information cycle. Data moved in one direction only: upward.
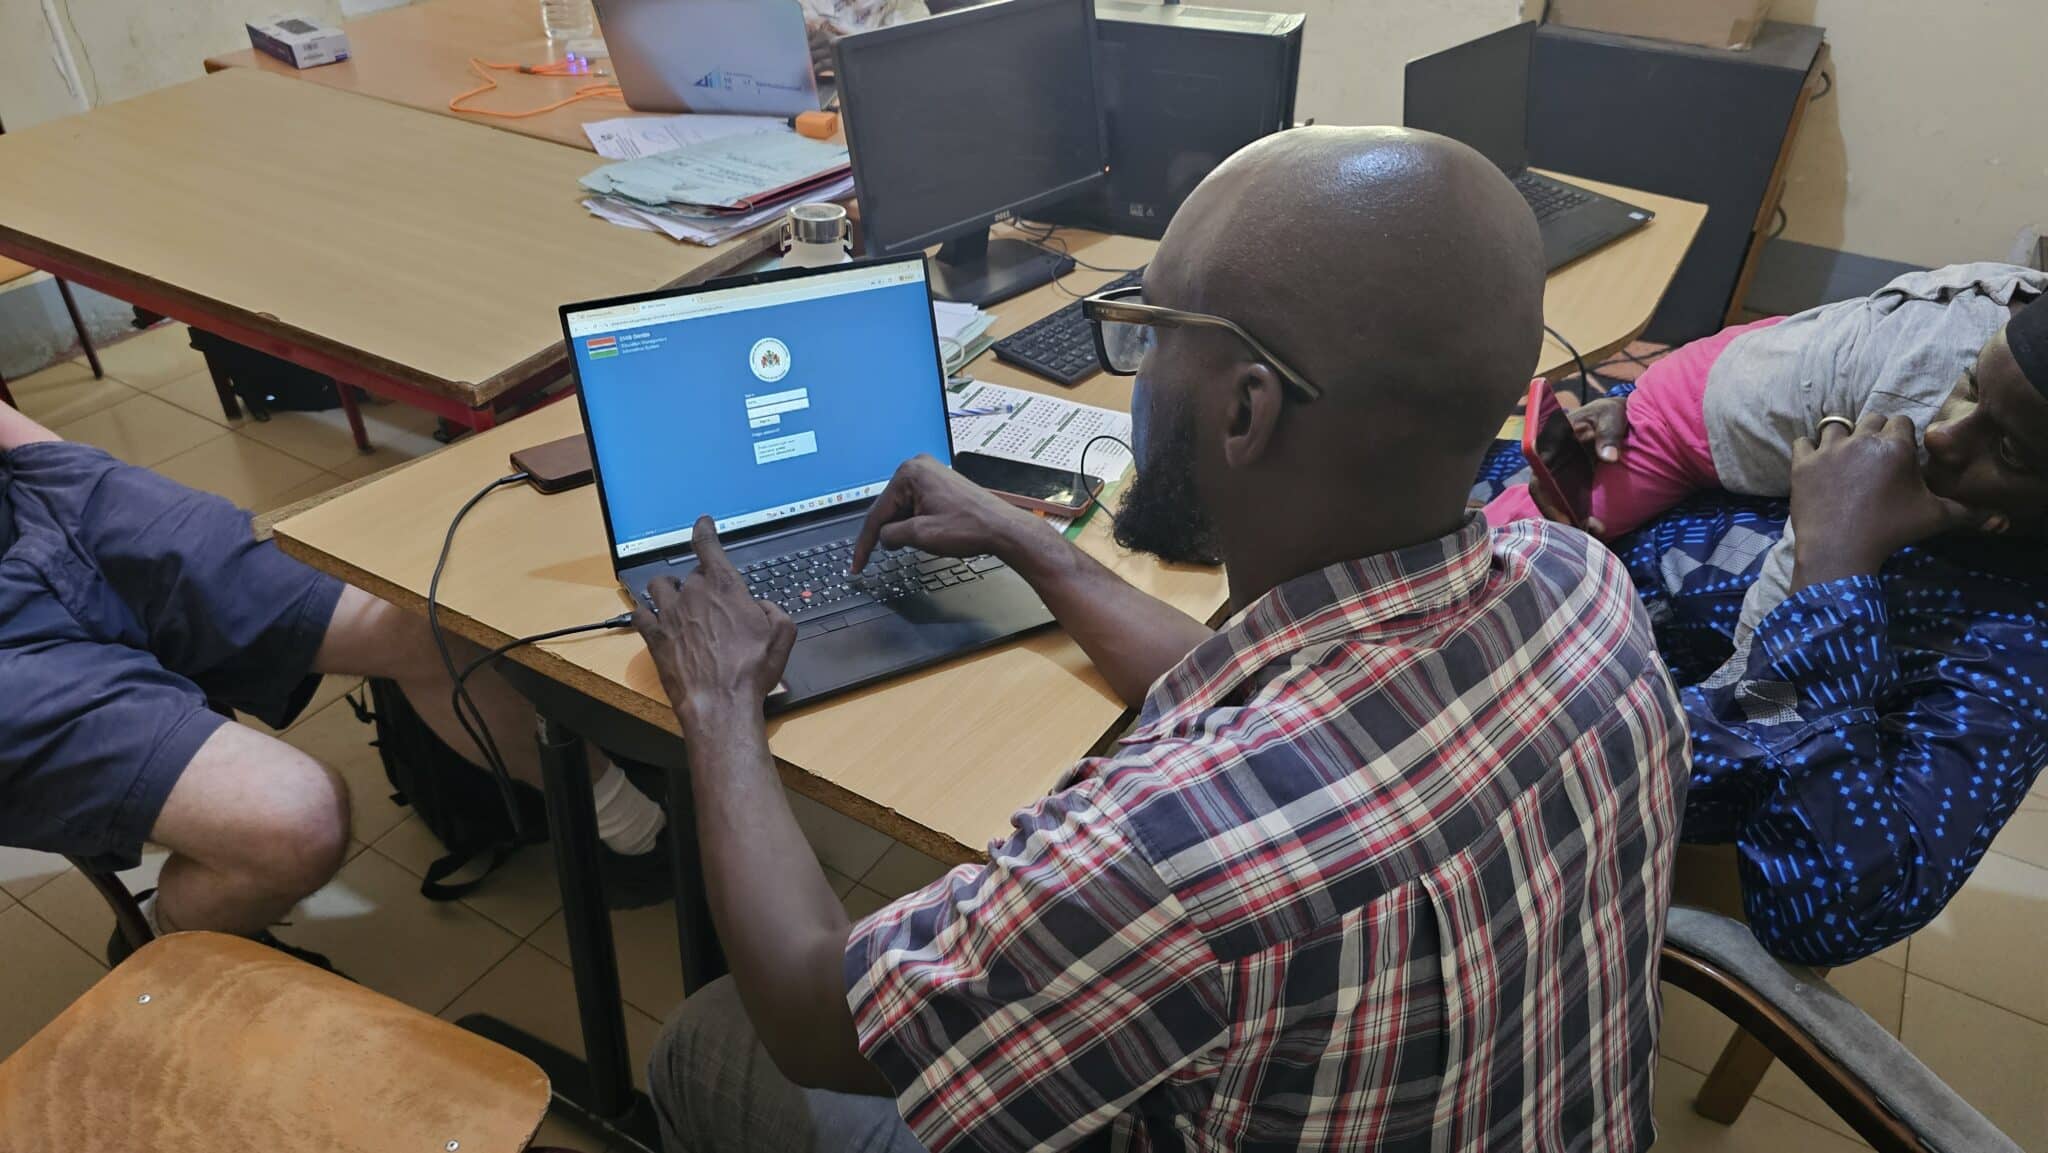
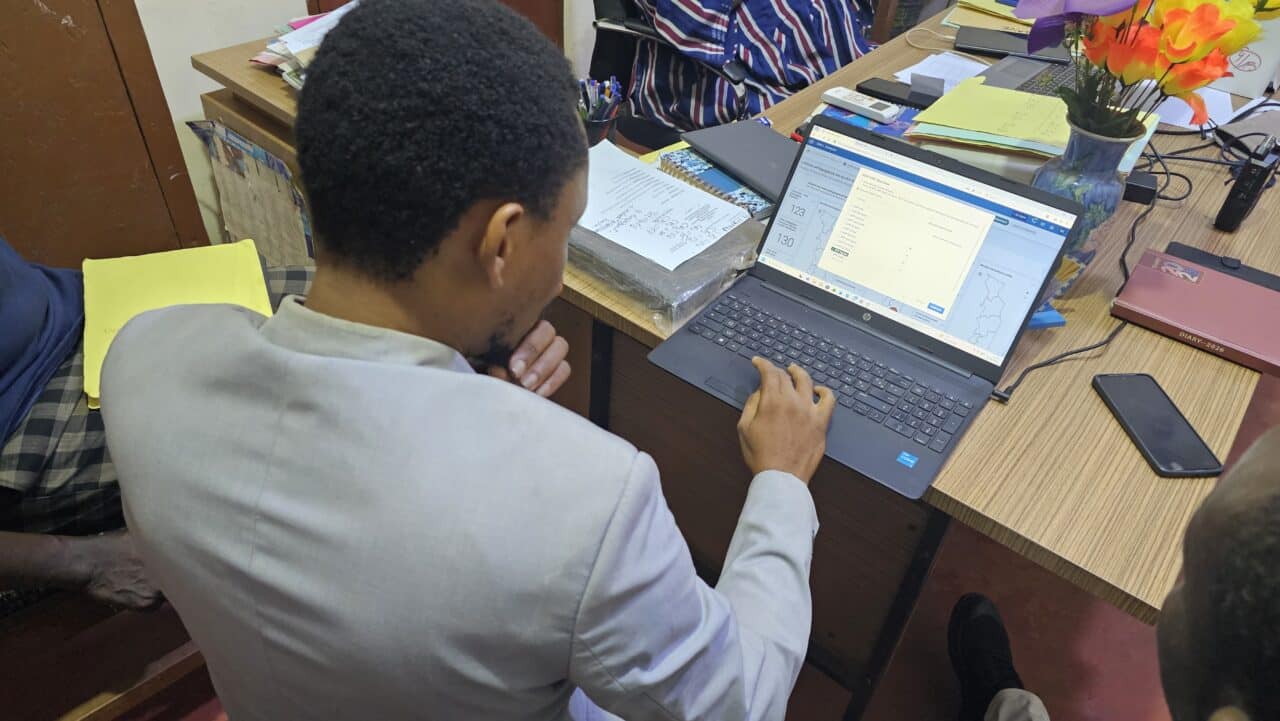
To address this, Togo’s Ministry of National Education added DHIS2 as an analytical layer on top of StatEduc, its established census system, and introduced a digital school observation module for inspectors. Regional directorates can now analyze census data themselves—from teacher distribution and infrastructure requirements, to micro-planning and resource allocation—rather than waiting on summaries prepared at the national level.
That success has now created new demands for data within the education system. Staff who rely on the data want it more often than an annual cycle produces it.
These findings come from an April 2026 study tour to Togo and The Gambia, part of “Empowering Districts and Schools with Data,” a project funded through the Global Partnership for Education’s Knowledge and Innovation Exchange (GPE KIX) and coordinated by the HISP Centre at the University of Oslo, with implementation support from HISP West and Central Africa. Togo’s work on DHIS2 has also been supported by the Norwegian Agency for Development Cooperation (Norad). The team met officials at national, regional and inspection levels; the findings reflect their accounts rather than a quantitative assessment of system performance.
Building on StatEduc to keep the census system intact
Togo’s EMIS, which is known locally as SIGE, for Système d’Information pour la Gestion de l’Éducation, was built over time as the ministry progressed from earlier digital approaches such as CSPro to StatEduc for the annual school census, then added DHIS2 on top to strengthen analysis, visualization and dissemination.
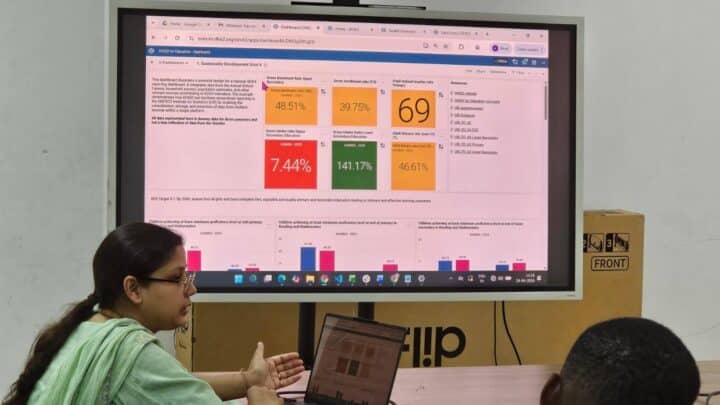
StatEduc, an education statistics application used in around 20 countries, remains the collection tool. DHIS2 processes what it gathers into dashboards, maps, dynamic tables and analytical reports covering indicators such as enrolment by level, teacher-pupil ratios and national exam pass rates, disaggregated by gender and disability status. Those products are available across administrative levels rather than only to the central statistics team, and current figures can be set against legacy data to show trends.
Regional teams described using the system for teacher distribution analysis, identification of infrastructure requirements, prioritization of school construction, identification of schools needing rehabilitation, assessment of classroom and furniture requirements, regional micro-planning and resource allocation. That analysis used to depend on the central level, but with DHIS2, regional staff can now do it themselves.
Because DHIS2 was added to the existing system, the ministry kept processes and institutional knowledge that already worked while avoiding the risk of replacing a mature census system outright. It also created a dependency: the analytical layer is only as current as what the census layer hands it.
Fitting the school observation workflow to the realities of a classroom visit
The digital form that inspectors filled in during school visits proved harder to use than expected. Inspectors visit schools to check the figures that schools report for the census and enter them into StatEduc, so their work shapes both how good the data is and how quickly it reaches planners. The Togo mission found that training given years earlier was never repeated, there were too few devices to go round, and the observation form did not suit the conditions it was used in.
The problems were practical. The form is long and a classroom visit is short. Batteries run down, and there is not always electricity to charge them. Inspectors were willing to work digitally, but the form required more time on a device than the school observation allowed.
The mission revealed the need for a form redesign rather than more technology: a shorter form, fewer questions, the ability to fill it in without a signal, and a split between quick notes taken in the classroom and the longer write-up that can wait.
Routine use has created additional demand for data outside the annual reporting cycle
The point raised most consistently during field visits came from users who had spent a year working with the platform. Both Inspectors and regional staff wanted updates more often than the annual census cycle produces them. The annual cycle wasn’t seen as a problem before, but when people began actually using the data to make in-year decisions, the wait became the most pressing constraint.
The time between when a school reports its figures and when that information becomes available in DHIS2 has become the bottleneck, and the challenge stems from the data collection and validation processes, rather than the platform itself. DHIS2 displays whatever it is given, whenever it is given. What determines the wait is when data are collected, how quickly they are validated, and how long the validated information sits before it reaches DHIS2. Those are institutional and resourcing questions, and they are harder to solve than standing up a dashboard.
The answer is not to trade validation for speed. It is to shorten the distance between the two. Because that distance is where the delay accumulates, the mission’s first recommendation was to strengthen interoperability between StatEduc and DHIS2, so that validated census data reaches the analytical layer through a streamlined transfer rather than manual steps.
Looking forward: Refresher training, workflow redesign and routine dashboard reviews
Alongside interoperability, priorities identified during the mission include refresher training and mentoring rather than one-off initial training; broadening analytical skills beyond a small group of specialists; redesigning the school observation workflow with the inspectors who use it; and building DHIS2 dashboards into the regular agenda of national and regional planning meetings, so that reviewing data becomes part of the planning cycle rather than an occasional activity.
Two of the mission’s conclusions apply beyond Togo. First, timeliness is an important part of data quality. Information that is accurate but arrives too late has limited value for decisions taken during the school year. Second, access to data does not necessarily lead to data use. Dashboards are an important step, but sustained data use depends on analytical skills, institutional incentives, leadership and the integration of data review into planning. On both counts, the Togo mission found that further gains are more likely to come from strengthening institutional processes and user engagement than from adding technical features.
ABOUT THIS SERIES: This is part of a series of posts documenting the GPE KIX study tour for the project “Empowering Districts and Schools with Data.” The project is coordinated by the HISP Centre at the University of Oslo and concludes in November 2026.